How to read contour lines: height, slopes and valleys
Read the numbers first, count the gaps, then use spacing and shape. Two invented diagrams turn contour lines into a hill and a stream valley.
Start with one line
A contour line connects places at the same elevation, measured from the map’s stated reference level. A line labelled 120 m therefore describes a whole set of places at 120 m. It is neither a path nor the outline of a wall.
Imagine a horizontal sheet passing through a hill at 120 m. The contour traces where that sheet meets the ground. Now imagine another sheet 10 m higher. Looking down at those intersections gives a useful starting picture of a contour map.
The two drawings in this lesson are invented schematics, not maps of real places. They have no horizontal scale. Their labels let us calculate height differences, but the drawings cannot supply distances on the ground.
Read the legend before counting
Check the elevation units and the contour interval: the vertical change between neighbouring regular contours. Metres and feet are different units. The interval is a height difference, not the width of a gap on the page. A map may also show supplementary contours; identify those in its legend before treating every line as one full step.
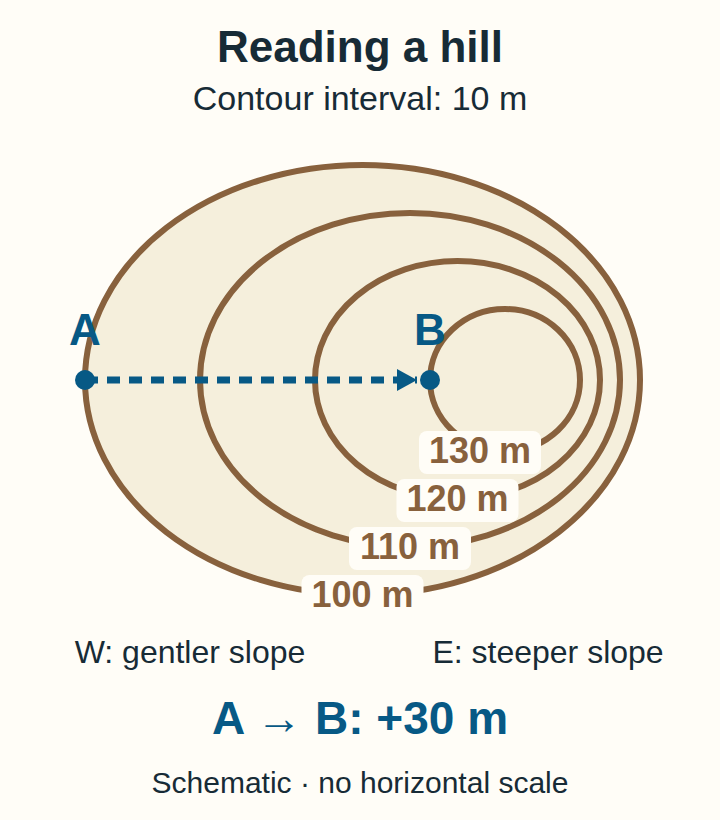
Our hill uses metres and a regular interval of 10 m. Its four nested closed lines read 100, 110, 120 and 130 m from the outside inward. The labels increase toward the centre, so this example rises inward.
The hill: four lines, three steps
Text version of the hill diagram: four closed contours lie inside one another, labelled 100, 110, 120 and 130 m. Their gaps are wide on the left, the western side, and narrow on the right, the eastern side. A sits on the western crossing of the 100 m line; B sits on the western crossing of the 130 m line. No exact summit height is marked.
From A to B, count the changes: 100 → 110, 110 → 120, and 120 → 130. That is three intervals of 10 m, giving a rise of 30 m. Subtracting the endpoint elevations gives the same result: 130 − 100 = 30 m. This is the height difference between the endpoints. It does not give the total ascent of an unspecified route with ups and downs.
Four visible lines do not mean four climbs of 10 m. The starting line tells you where the count begins. You have not gained a contour interval merely by standing on it.
Spacing tells a different story
On the same map, with the same contour interval, closely packed contours indicate a steeper slope than widely spaced ones. Compare spacing across the contours. A rise of 10 m occurs over less horizontal distance where the lines crowd together.
In our hill drawing, both sides pass through the same four elevations. The eastern side packs those changes into a narrower strip, so it is steeper. The western side spreads them out. Neither side gains more height between its 100 m and 130 m contours.
This comparison needs a common map scale and contour interval. Enlarging a picture spreads its lines apart without changing the landscape. Our unscaled drawing supports a relative comparison within the picture, not a numerical slope angle.
A valley: follow the numbers through the V
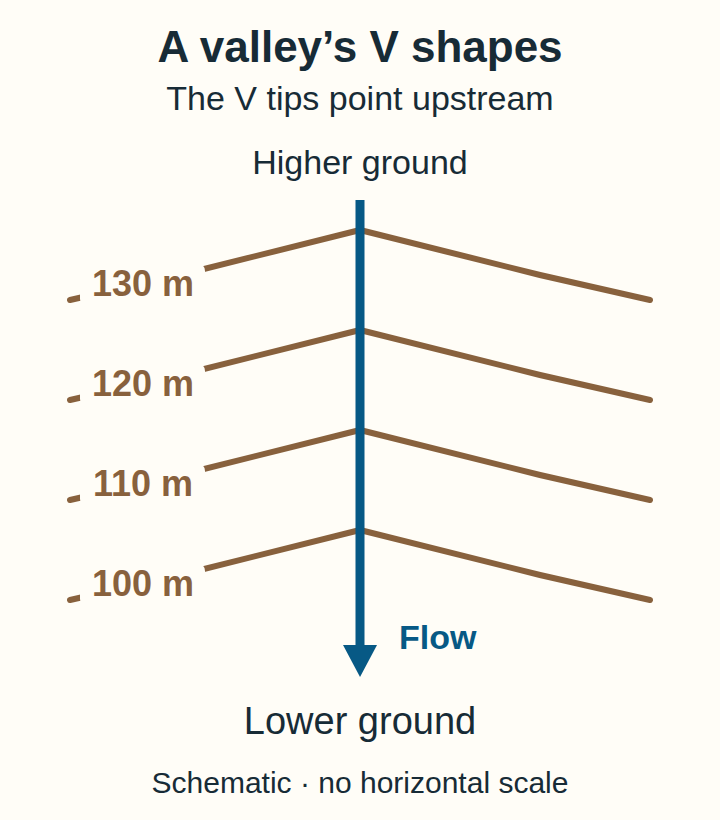
Where contours cross a stream valley, their bends point upstream toward higher ground. On a ridge or projecting spur, contour bends can point downhill. A V shape alone is therefore not enough: use the elevation labels and the surrounding pattern.
Text version of the valley diagram: a stream runs vertically down the page. Four contours cross it in the order 130, 120, 110 and 100 m from top to bottom. Each crossing bends into a V whose tip points up the page, toward the higher labels. The stream flows down the page, opposite the direction of those tips.
Trace the stream in the drawing: 130 → 120 → 110 → 100. The labels fall by 30 m altogether. Turning the paper upside down would change which way the V appears to point on your desk; it would not change which end is higher.
A closed loop is not an exact summit
Closed contours can also describe a depression. Read the labels and the map’s symbols together before deciding whether the ground rises or falls inward.
Our hill’s innermost line is at 130 m. That is the height of the line, not an exact height for the top. The drawing gives no measured summit value. Writing 135 m because it seems halfway to the next interval would add information we do not have.
Count the height changes
Choose an answer, or open the answer explanations to check the calculation without using the buttons.
Answers and explanations
- 40 m: That counts four lines as four intervals. Between these four lines there are three intervals.
- 30 m: 110 − 80 = 30 m. The three intervals are 80→90, 90→100 and 100→110.
- 110 m: 110 m is the finish elevation. The question asks for its height above the 80 m start.
Try a different legend
A second imaginary map uses a 20 m contour interval. P lies on 160 m and Q on 220 m. Write the intervening sequence before calculating the rise. Can this information also tell you the horizontal distance from P to Q?
Answer: 160 → 180 → 200 → 220 is three intervals, so Q is 60 m higher. The horizontal distance remains unknown: no positions or scale have been supplied. Keeping those two questions separate is the most useful habit to take to your next map.