This explosion crossed your city seven times
Krakatoa's pressure wave circled the planet for five days. Pick your city and start it.
The wave
Pick a city, tap the map, or start the wave.
Seven passages in our model
A simple model: one speed of 1,120 km/h and a perfect ring. The real wave travelled at different speeds in different directions, so real times differ by hours.
| City | km from Krakatoa | Hours after the explosion |
|---|---|---|
| Almaty | 6193 | 6, 30, 41, 66, 77, 102, 113 |
| Anchorage | 11385 | 10, 26, 46, 61, 82, 97, 117 |
| Auckland | 7767 | 7, 29, 43, 65, 78, 100, 114 |
| Beijing | 5238 | 5, 31, 40, 67, 76, 103, 112 |
| Berlin | 10682 | 10, 26, 45, 62, 81, 98, 117 |
| Bogotá | 19851 | 18, 18, 53, 54, 89, 89, 125 |
| Buenos Aires | 15180 | 14, 22, 49, 58, 85, 94, 121 |
| Cairo | 8846 | 8, 28, 44, 64, 79, 99, 115 |
| Cape Town | 9353 | 8, 27, 44, 63, 80, 99, 116 |
| Chicago | 15833 | 14, 22, 50, 57, 86, 93, 121 |
| Delhi | 4902 | 4, 31, 40, 67, 76, 103, 112 |
| Dublin | 11979 | 11, 25, 46, 61, 82, 97, 118 |
| Glasgow | 11788 | 11, 25, 46, 61, 82, 97, 118 |
| Honolulu | 10948 | 10, 26, 46, 62, 81, 97, 117 |
| Istanbul | 9330 | 8, 27, 44, 63, 80, 99, 116 |
| Jakarta | 158 | 0, 36, 36, 71, 72, 107, 107 |
| Kazan | 8581 | 8, 28, 43, 64, 79, 100, 115 |
| Kolkata | 3689 | 3, 32, 39, 68, 75, 104, 111 |
| Kyiv | 9478 | 8, 27, 44, 63, 80, 99, 116 |
| Lagos | 11409 | 10, 26, 46, 61, 82, 97, 117 |
| Lima | 17979 | 16, 20, 52, 55, 88, 91, 123 |
| London | 11612 | 10, 25, 46, 61, 82, 97, 118 |
| Los Angeles | 14561 | 13, 23, 49, 58, 84, 94, 120 |
| Madrid | 12062 | 11, 25, 47, 61, 82, 96, 118 |
| Manila | 2871 | 3, 33, 38, 69, 74, 105, 110 |
| Mexico City | 16974 | 15, 21, 51, 56, 87, 92, 122 |
| Minsk | 9770 | 9, 27, 44, 63, 80, 99, 116 |
| Moscow | 9219 | 8, 28, 44, 63, 80, 99, 115 |
| Nairobi | 7626 | 7, 29, 43, 65, 78, 100, 114 |
| New York | 16166 | 14, 21, 50, 57, 86, 93, 122 |
| Novosibirsk | 7107 | 6, 29, 42, 65, 78, 101, 114 |
| Paris | 11473 | 10, 25, 46, 61, 82, 97, 117 |
| Perth | 3072 | 3, 33, 38, 69, 74, 104, 110 |
| Reykjavik | 12346 | 11, 25, 47, 60, 83, 96, 118 |
| Rome | 10702 | 10, 26, 45, 62, 81, 98, 117 |
| Saint Petersburg | 9777 | 9, 27, 44, 63, 80, 98, 116 |
| Santiago | 15598 | 14, 22, 50, 58, 85, 93, 121 |
| Sochi | 8574 | 8, 28, 43, 64, 79, 100, 115 |
| Sydney | 5624 | 5, 31, 41, 66, 77, 102, 112 |
| São Paulo | 15535 | 14, 22, 50, 58, 85, 93, 121 |
| Tashkent | 6428 | 6, 30, 41, 66, 77, 101, 113 |
| Tbilisi | 8109 | 7, 29, 43, 64, 79, 100, 114 |
| Tokyo | 5861 | 5, 31, 41, 66, 77, 102, 112 |
| Toronto | 15813 | 14, 22, 50, 57, 86, 93, 121 |
| Vancouver | 13417 | 12, 24, 48, 60, 83, 95, 119 |
| Vienna | 10443 | 9, 26, 45, 62, 81, 98, 117 |
| Vladivostok | 6088 | 5, 30, 41, 66, 77, 102, 113 |
| Yekaterinburg | 8088 | 7, 29, 43, 64, 79, 100, 114 |
Nobody in Glasgow heard a thing
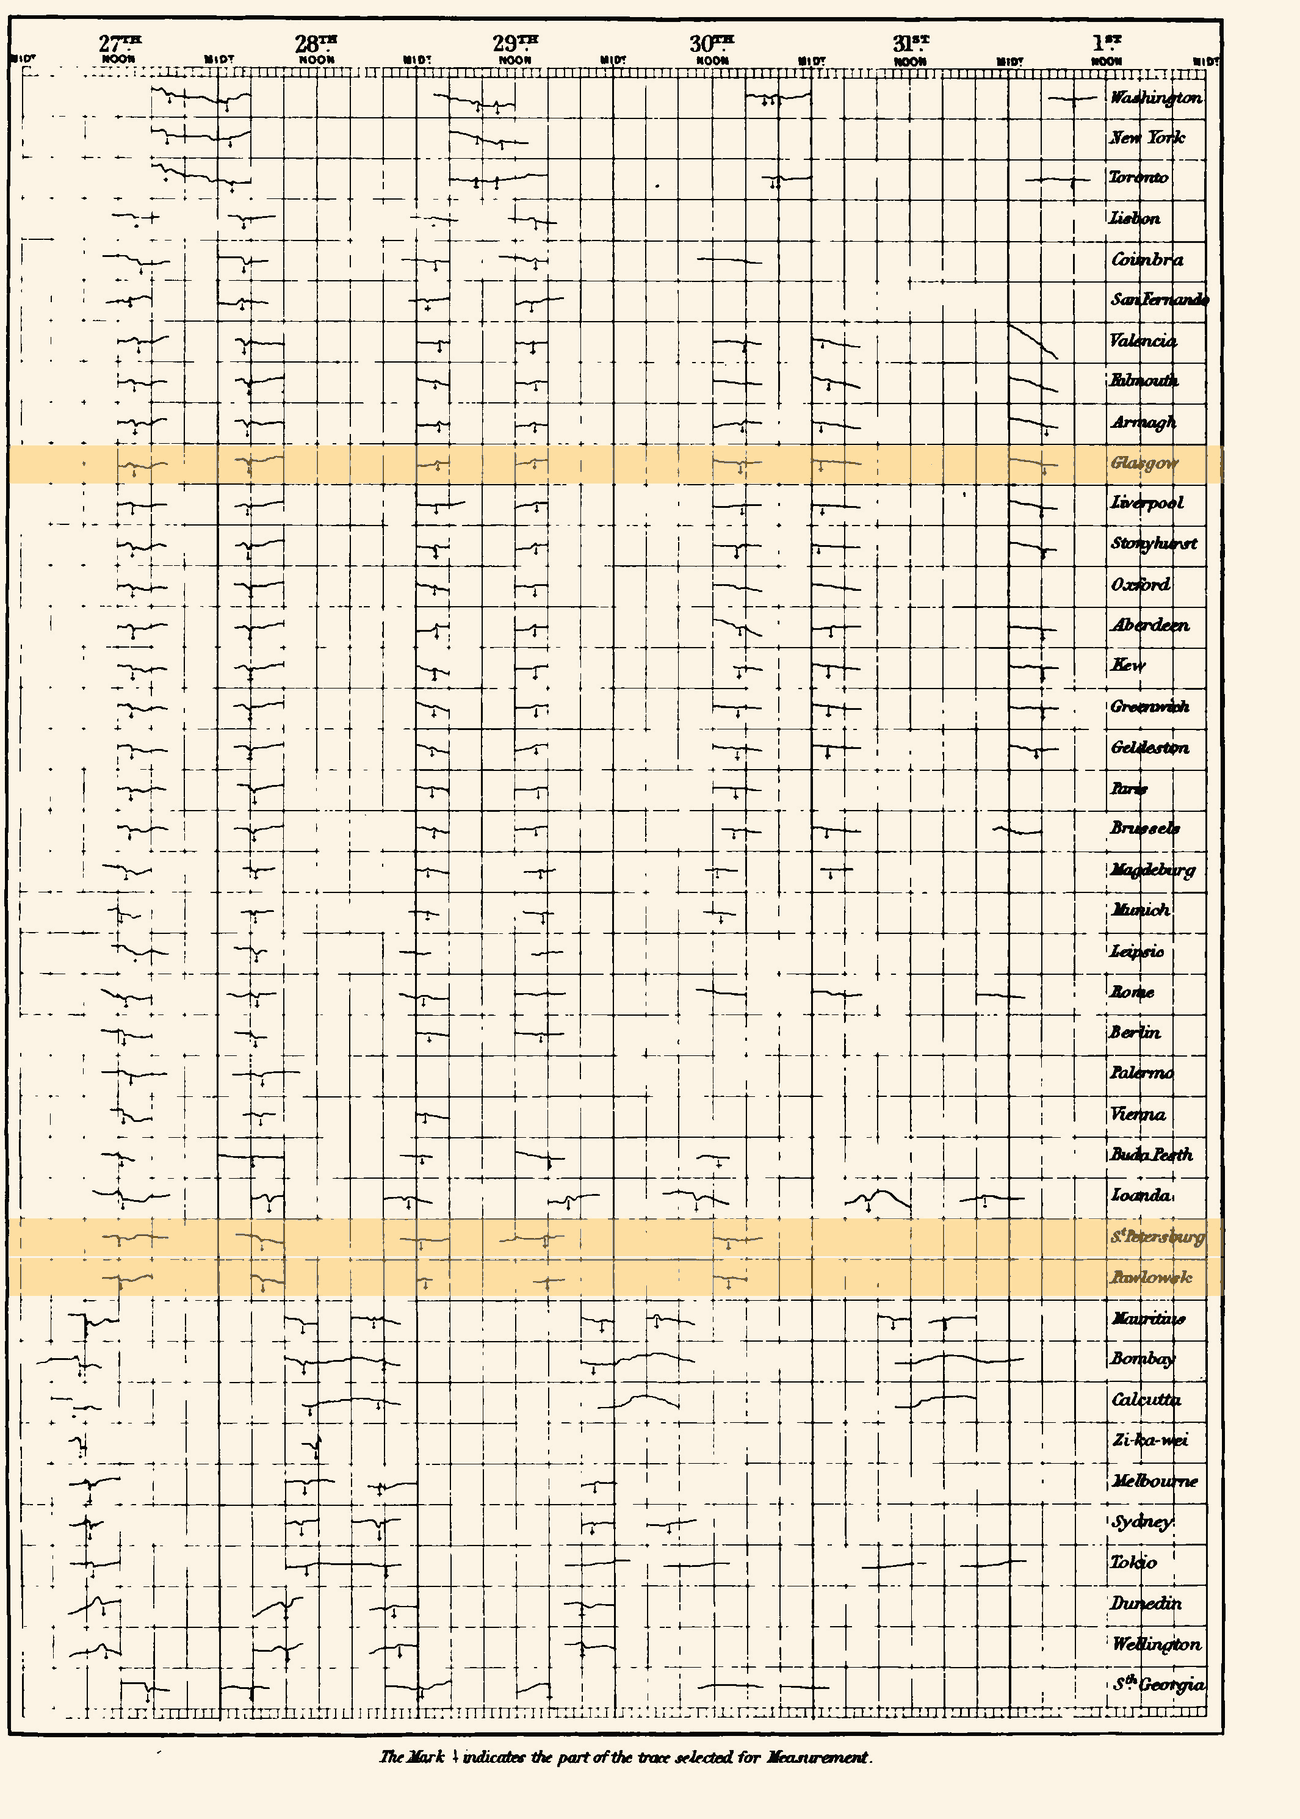
The ring on the map is our simplification: one speed, a perfect circle. The passages are real: many stations logged all seven, though not every one, and for your own city the seven comes from the model, not a measurement. In Glasgow that week a barograph, a clock-driven recorder of air pressure, was running; this one traced its curve by photography. It marked the wave 11 hours after the explosion, then at 25, 48, 59, 84, 94 and 121 hours. The map's hours for Glasgow differ from these by up to three.
The last mark came five days after the blast. Nobody in Glasgow heard any of it. Krakatoa was almost 11,800 km away.
More than 50 stations caught the wave. Every row of the plate below is one of them: Washington at the top, South Georgia at the bottom. Time runs left to right, from 27 August to 1 September. Each small kink is the same wave. The three amber rows are Glasgow, with all seven, and St Petersburg and Pavlovsk, which stop at five because no later record reached the committee.
Two things left the volcano
You may have read that this was a sound that circled the Earth. That is not quite what happened. Two different things left Krakatoa.
The first was a sound you could hear, and that alone was absurd. It carried over about a thirteenth of the Earth's surface. On Rodrigues Island, more than 4,600 km away, the chief of police, James Wallis, wrote down reports "coming from the eastward, like the distant roars of heavy guns". The dashed circle on the map is that distance.
Far from Java, hardly anyone thought of a volcano. One listener in Ceylon did wonder about "some volcano in action out at sea", but guns were the usual guess. At Tavoy in Burma, "thinking there might be a wreck or a ship in distress", the superintendent sent out the police launch, "but they could see nothing". On Diego Garcia, too, they assumed a vessel in trouble. In North Borneo, a letter reported, people inland thought they were being attacked from both coasts and fled their village.
The second thing is the one on your map: a pressure wave, with each swing lasting 100 to 200 minutes. Call it a note and it sits 17 to 18 octaves below the lowest sound a person can hear. A piano spans seven. At distant stations it changed the pressure by a few tenths of a percent at most, about what you get from a lift going up several floors, spread over a couple of hours. No ear is built for that. A barograph is.
The whole sky moved at once
What kind of wave was it? Scientists argued about that, and the theory kept being refined for decades. Its speed looked like sound; its enormous wavelength did not. Some compared it to a long swell on the ocean. The eventual answer was neither. In the main part of the wave, air at every height moves in step, and the wave slides along the surface of the planet. It is closer to the atmosphere ringing than to a noise passing through it.
It is now called a Lamb wave, after the mathematician Horace Lamb. "Lamb waves are rare," says David Fee of the University of Alaska Fairbanks. The largest explosions in the atmosphere make them. On 30 October 1961 the atmospheric disturbance from the Soviet Tsar Bomba went around the Earth three times.
The pen that ran off the chart
Now go back to the source. The most frightening picture in the Royal Society's 1888 report is not a map. It is a chart from a gasworks.
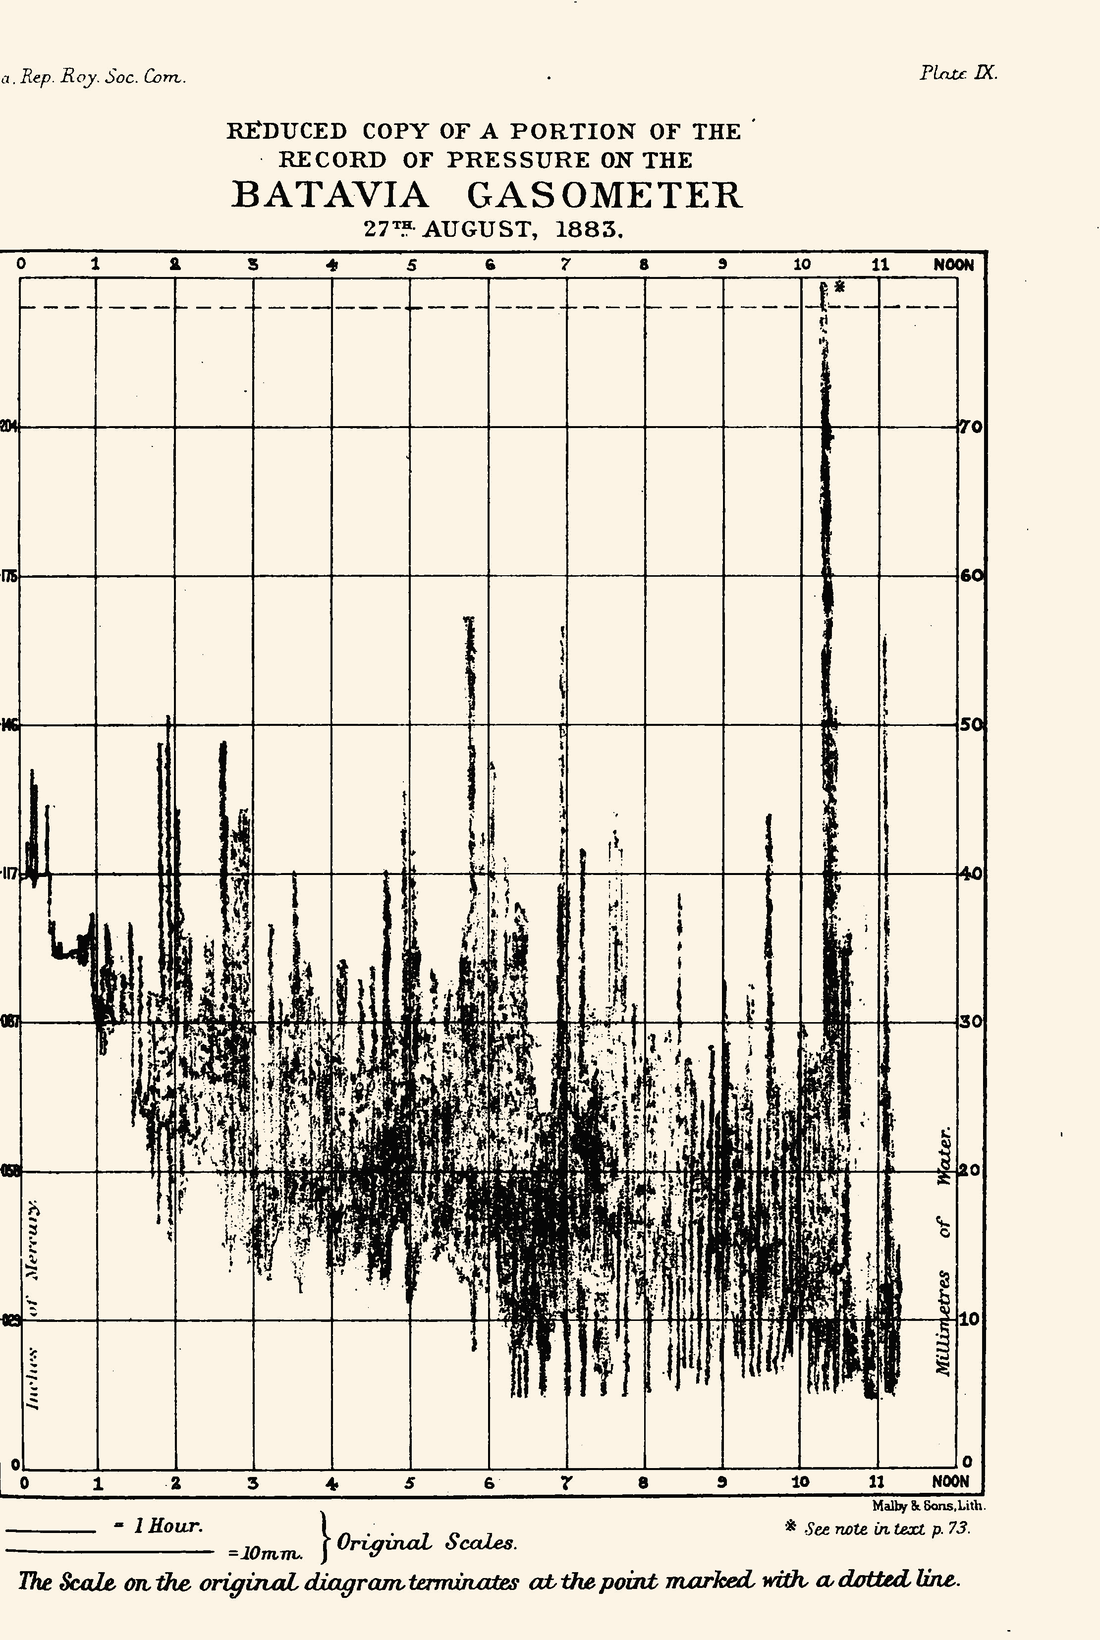
At Batavia, now Jakarta, about 150 km from the volcano, a gauge recorded the pressure on a gasometer. It was never meant to measure anything else, and the air moved it anyway. Read the plate from the left. From midnight the pen is scratching up and down. Just after ten, something goes straight up through all of it.
The dashed line at the top is where the chart ended. "The scale on the original diagram terminates at the point marked with a dotted line," the plate says. The report adds that the pencil might have gone higher, "had the construction of the recording apparatus allowed of its doing so".
What the air and the sea did
Air waves like that burst in windows and cracked walls at Batavia and Buitenzorg. Lamps were thrown down, gas jets went out, and a gasometer "leaped out of its well".
Close to the volcano, the sea did the killing. At least 36,417 people died (some estimates run far higher), most of them in waves up to 40 metres high, and 165 coastal villages were destroyed. "The best testimony to this is lost," Chambers's Journal wrote of the sea's first drawing back in 1884, "since those who witnessed it were its victims."
A clerk in London sets the clock
So when exactly did it happen? The report says there is "otherwise no satisfactory or complete evidence" of the moment of the great explosion. The answer had to come from paper.
In December 1883 Robert Scott of the Meteorological Council gave the Royal Society a note on "a series of barometrical disturbances which passed over Europe" between 27 and 31 August. A note by General Richard Strachey followed it, and together they showed what the disturbances were. The Royal Society's committee then gathered barograms from 50 observatories. The detail, under Strachey's general supervision, fell to R. H. Curtis, "one of the senior clerks in the Meteorological Office".
The method is lovely. Take six stations around the volcano: Calcutta, Shanghai, Bombay, Melbourne, Mauritius, Sydney. On each trace find the deepest point of the dip. You know how far each station is from Krakatoa, so you can run the wave backwards to its start. The dip comes 36 minutes after the first jump, so take that off too. Result: a probable 2:56 Greenwich time, 9:58 in the morning at the volcano. Another chapter of the same report prints 10:02, from the Dutch mining engineer R. D. M. Verbeek, and later accounts such as Nautilus repeat that figure. In St Petersburg M. Rykachev, using the same kind of data, took 10:27 as probable.
Then they checked it against the only continuous pressure record close by. With that moment and that speed, the jump should have reached Batavia at 10:11 local time. The gasworks chart shows it between 10:15 and 10:20. The report allows for "the possible error of the clock at a non-scientific establishment".
A desk in London had worked out the probable moment of an explosion on the far side of the planet, to within minutes by its own reckoning, using instruments that had no idea what they were drawing.
It was never a circle
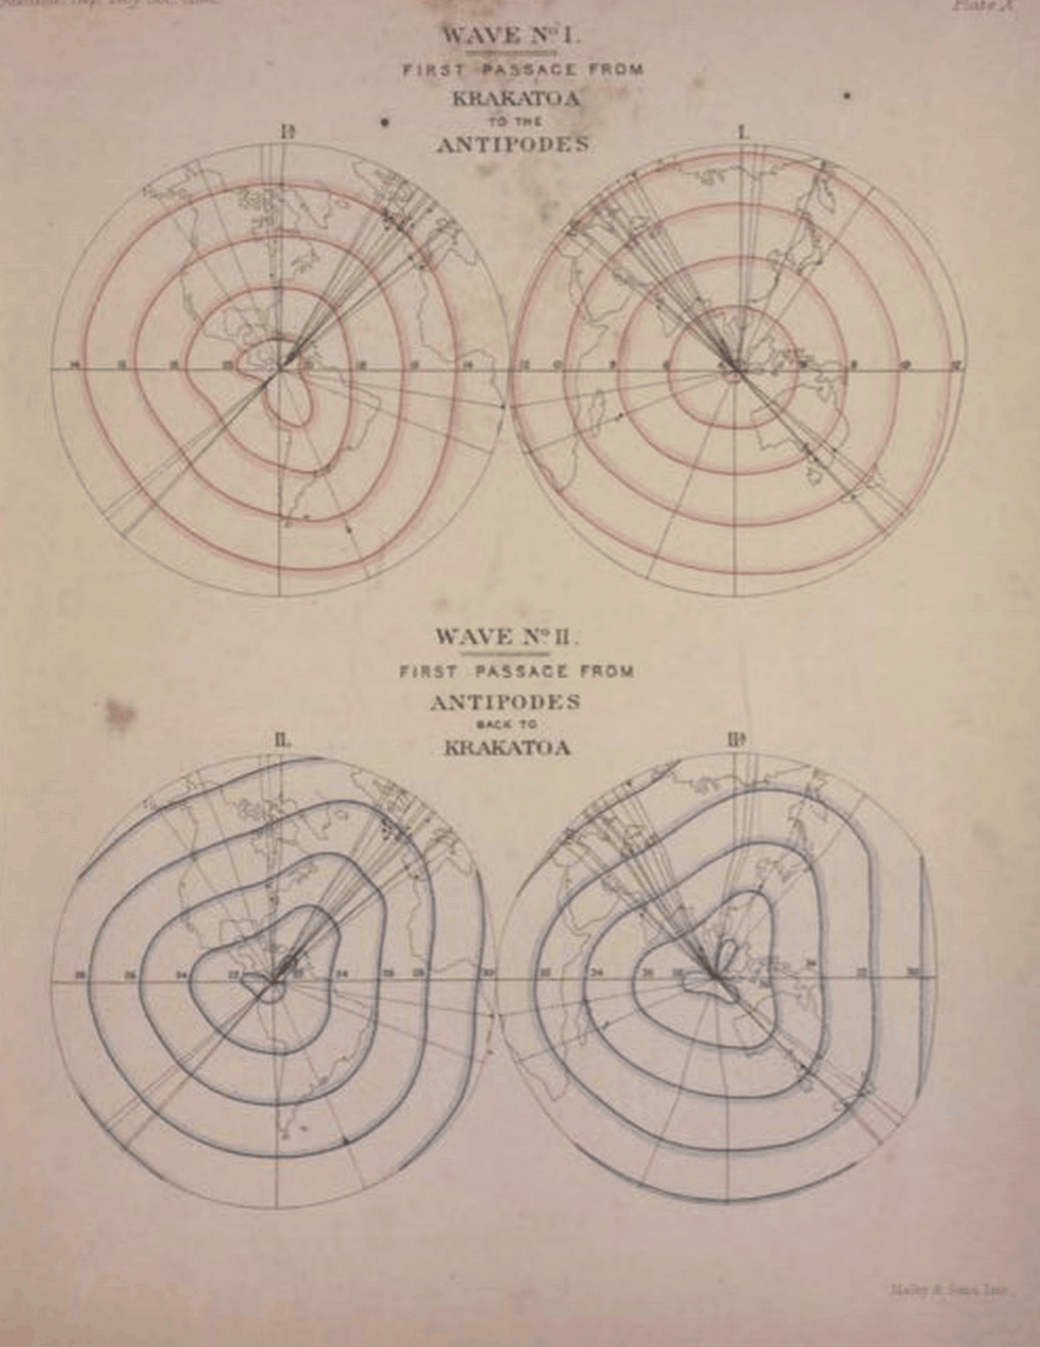
Our ring is perfect and wrong. The committee drew the real wave at two-hour steps: red going out, blue coming back. It leaves Krakatoa nearly round, closes on a point on the far side of the Earth near Medellín, and comes back lumpy. About a day and a half after the blast it had grown three distinct lobes.
The likely reason is wind. The wave running with the westerlies went faster than the one running against them, by about 28 miles an hour in the report's sums. In 1929 G. I. Taylor fitted the three lobes by assuming a plausible pattern of winds. So the times on our map can be hours off. For Glasgow, the model says 11, 25, 46, 61, 82, 97 and 118 hours. The Glasgow record said 11, 25, 48, 59, 84, 94 and 121.
And on each lap the wave came back to where it started. By then only a third of the island was left above the sea.
What else spread from the volcano
- The sea: tide gauges caught the wave at Aden, 12 hours after it left. A good steamer took 12 days.
- The ash: it circled the equator in 13 days. People saw blue and green suns.
- The sunsets: three months later the afterglow was so red that fire engines were called out in New York, Poughkeepsie and New Haven. Unusual sunsets went on for three years.
- The stone: rafts of pumice, in places thick enough to hold men and trees, took 10 months to cross the Indian Ocean. Others were still afloat two years later.
- The cold: global temperatures fell by as much as 1.2 °C the next year and were not normal again until 1888.
Seven again
On 15 January 2022 the Hunga volcano in Tonga exploded. Judged by the Lamb wave, it was comparable to Krakatoa. The wave circled the planet four times in one direction and three in the other, "the same as observed in the 1883 Krakatau eruption". Seven again.
This time people heard it about 10,000 km away, as repeated booms around Alaska some nine hours later. David Fee was one of them, and he studies exactly this for a living. "I heard the sounds but at the time definitely did not think it was from a volcanic eruption in the South Pacific," he said. In 139 years, that part had hardly changed.
What changed was the number of pens. In York, the developer Sandy Macdonald watched the wave arrive on a Raspberry Pi with a small pressure sensor, worked out when it should come back from the other side, said 01:00 GMT, and caught it at about 01:40. In Hawaii, phones recorded it. "Not only did the smartphones pick up the direct arrival, but also the multiple circumglobal transits of the air wave," said Milton Garcés, who runs the University of Hawaiʻi's Infrasound Laboratory. His lab's RedVox recorder is a free app.
In 1883 it took months and barograms sent to London to learn what had crossed the planet. The full account, with 50 observatories and a clerk, took until 1888. The next ring will cross your city too. You will not hear it. Your phone might.
Where these numbers come from
The map is our own model: a sphere, one speed of 1,120 km/h, inside the 300 to 325 m/s the observations gave. Hours for your city come from that model and are not measurements. The measured Glasgow hours are from the report's tables, as given by Thomas Gabrielson in Acoustics Today; they mark the deepest point of the dip on the first two passages and often a sudden rise after that. The dashed circle uses 4,653 km for Rodrigues, from Simkin and Fiske's summary; the report says nearly 3,000 English miles and Gabrielson says more than 4,800 km.
The 17 to 18 octaves are our arithmetic, from a 100 to 200 minute period and a 20 Hz limit of hearing. The lift is also ours: near the ground, pressure changes by about 12 pascals per metre, and Gabrielson gives peaks of a few tens to a few hundred pascals at distant stations. Plates are from the 1888 report, cropped; the first two are tinted to the colour of paper and the amber bands are ours.
Two things we could not stand behind. Popular accounts convert the gasworks reading into more than 172 decibels at 160 km, starting from a jump of 2.5 inches of mercury. Neither scan of the 1888 report has that figure: its own table puts the jump at 0.37 inches, about 156 decibels by our arithmetic. But the pen left the scale, so the true peak is unknown and we quote no loudness. And the often quoted log entry from Captain Sampson of the Norham Castle, about the eardrums of half his crew, appears in Nautilus with a later book as its source. The 1888 report quotes Sampson on the flames and the balls of fire on his yardarms. We searched two scans of it and did not find that line.
Sources & further reading
- The Eruption of Krakatoa and Subsequent Phenomena: Report of the Krakatoa Committee of the Royal Society, ed. G. J. Symons, 1888 (scan used for plates VIII and IX)
- The same report, colour scan used for plate X
- Thomas B. Gabrielson. Krakatoa and the Royal Society: the Krakatoa explosion of 1883. Acoustics Today, April 2010
- Volcano World, Oregon State University: Describe the 1883 eruption of Krakatau, from Simkin and Fiske
- Nature, 12 June 1884: Krakatoa and the Sun-Glows
- Chambers's Journal, 8 November 1884, Project Gutenberg
- Matoza et al. Atmospheric waves and global seismoacoustic observations of the January 2022 Hunga eruption, Tonga. Science, 2022, summary at USGS
- University of Alaska Fairbanks Geophysical Institute: Hunga volcano eruption provides an explosion of data, 2022
- University of Hawaiʻi News: Hawaiʻi phones capture data in Tonga volcano blast, 2022
- Tom's Hardware: Raspberry Pi detects shockwave from Tonga volcano eruption, 2022
- Nuclear Weapon Archive: The Tsar Bomba
- Aatish Bhatia. The Sound So Loud That It Circled the Earth Four Times. Nautilus, 2014
- Watch Coru’s video: The Explosion That Reached Glasgow Seven Times (YouTube, English)