Raise the Bar: Where Lightning Strikes on Earth
Sixteen years of lightning seen from space on one map. Raise the bar: at 50 flashes per square kilometre a year mostly Africa is left, at 200 just two places, and the brightest is not on land.
Your lightning map
Move the threshold slider or press 10, 50, 100 or 200 and watch what is left on the map. Without scripts there is a table of thresholds below and the whole map as a picture.
Threshold: flashes per km² a year
Tap the map to read the value at a point.
What is left at each threshold
Cells are the 0.1° squares of the satellite grid between 38°S and 38°N; thresholds are flashes per km² a year. Names are the nearest populated places from the hotspot table of Albrecht et al. 2016.
| Threshold | Cells | Area | Last places standing |
|---|---|---|---|
| 10 | 295,557 | 34.6 million km² | Among them: Lake Maracaibo, Kabare, Kampene, Cáceres, Sake… |
| 50 | 8,880 | 1.1 million km² | Among them: Lake Maracaibo, Kabare, Kampene, Cáceres, Sake… |
| 100 | 409 | 49,899 km² | Among them: Lake Maracaibo, Kabare, Kampene, Cáceres, Sake… |
| 200 | 4 | 489 km² | Last standing: Lake Maracaibo, Kabare. |
What you are looking at
This is sixteen years of lightning, seen from space. The LIS sensor on the TRMM satellite counted flashes from 1998 to 2013 in the band between 38°S and 38°N, in cells of 0.1°. Towards the poles the LIS/OTD climatology fills in with 0.5° cells: beyond 38° it holds only the OTD sensor's observations of 1995 to 2000.
Now look at the oceans. Almost dark. Per square kilometre, land gets about ten times more lightning than the sea.
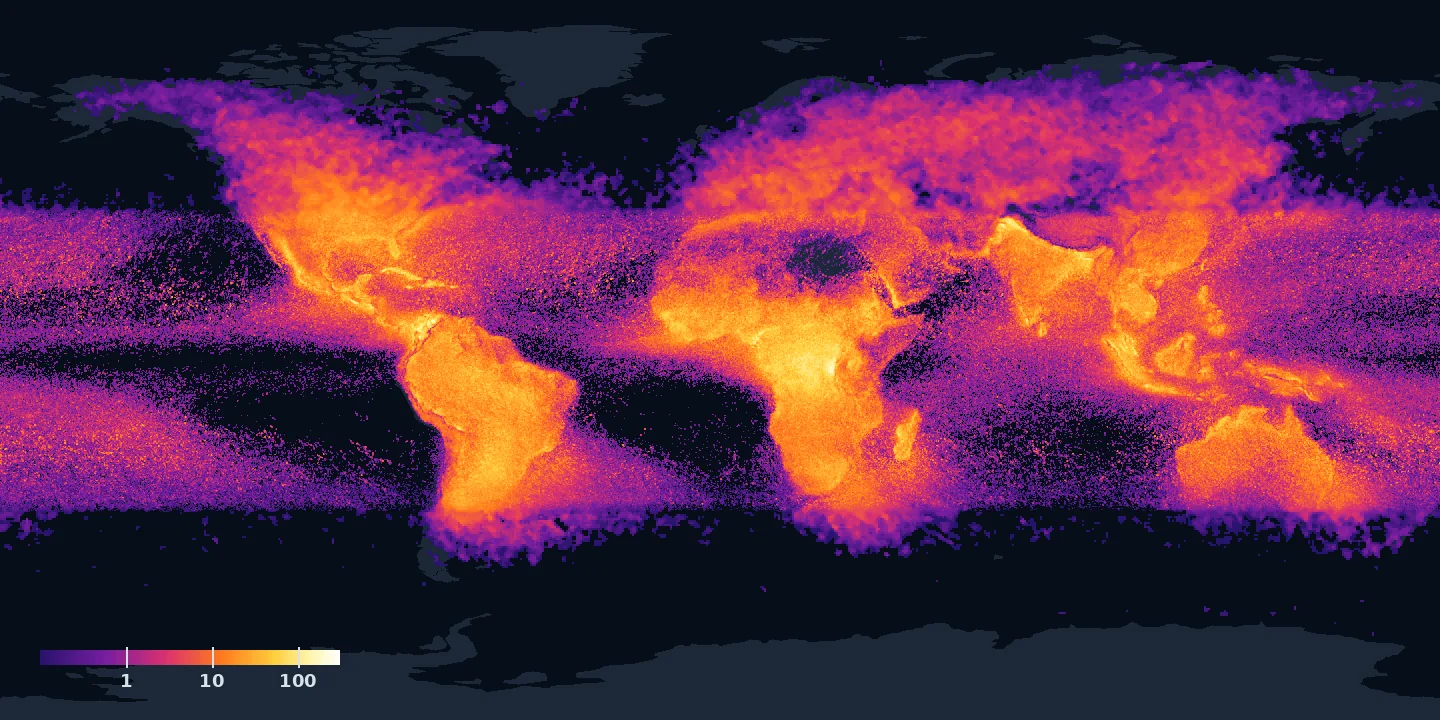
Why land
Lightning needs a strong updraft. Sunlit land heats up fast, and hot air shoots up for kilometres, where ice crystals and soft hail, graupel, collide and split the charge.
The sea warms slowly. Its storms rise gently and spark far less.
Raise the bar
Fifty flashes per square kilometre a year: 8,880 cells are left on the map, mostly Africa. Of the 500 top lightning hotspots on the planet, 283 are in Africa. One hundred: 409 cells. Two hundred: four cells.
Two places are left. One in eastern DR Congo, near Kabare: 205 flashes per square kilometre a year. And the brightest of all is not on land.
It's a lake. Lake Maracaibo, in Venezuela: about 233 flashes per square kilometre a year, 232.5 in the cell at 9.75°N, 71.65°W.
Why the lake
The lake lies between the most northern ridges of the Andes, and its water is warm all year, 28 to 31 °C. At night, breezes slide down the Andes and in from the shore, and collide over the warm water. The air can only go up.
Storms break out on about 297 nights a year. Lightning avoids the sea. But it loves this lake.
How to read the map
The map is a grid of 0.25° cells. Inside the satellite's band each cell holds the highest value of the 0.1° cells that fall into it, so a place goes dark exactly when its last cell drops under the bar. The threshold runs from 0.1 to 300 flashes per square kilometre a year in 96 equal logarithmic steps of about 9 % each; 10, 50, 100 and 200 are placed exactly. The cells and area left at each threshold are counted on the original 0.1° grid between 38°S and 38°N; the names of the last places are the nearest populated places from the table of 500 hotspots in Albrecht et al. 2016.
Tap the map to read the value at a point. The Share button passes on only the slider position. The page stores and sends nothing.
Data: NASA TRMM Lightning Imaging Sensor, LIS 0.1° VHRFC (Albrecht et al. 2016), doi:10.5067/LIS/LIS/DATA301; beyond 38°: LIS/OTD 0.5° HRFC (Cecil 2001), doi:10.5067/LIS/LIS-OTD/DATA302; NASA Global Hydrometeorology Resource Center DAAC. Land from Natural Earth. NASA took no part in this page and does not endorse it.
Sources & further reading
- Coru Short: lightning avoids the sea (YouTube)
- Albrecht et al. 2016, Where Are the Lightning Hotspots on Earth? BAMS 97, 2051–2068
- Albrecht et al. 2016, Table S3: the 500 hotspots (NASA GHRC)
- Christian et al. 2003, Global frequency and distribution of lightning, JGR 108
- NOAA NSSL, Severe Weather 101: Lightning FAQ
- NASA Earth Observatory, Global Lightning Activity
- NASA, Earth's New Lightning Capital Revealed
- LIS 0.1° VHRFC V1, NASA GHRC DAAC
- LIS/OTD 0.5° HRFC V2.3.2015, NASA GHRC DAAC
- GHRC, LIS/OTD gridded climatology dataset guide
- Natural Earth, 1:110m land (public domain)